SME KPI Dashboard
Your business speaks to you in 5 numbers: margin, break-even, CAC, LTV and cash. This template calculates them by itself and puts a traffic light on top, so you decide instead of guess.
What you get
→ Dashboard with traffic lights
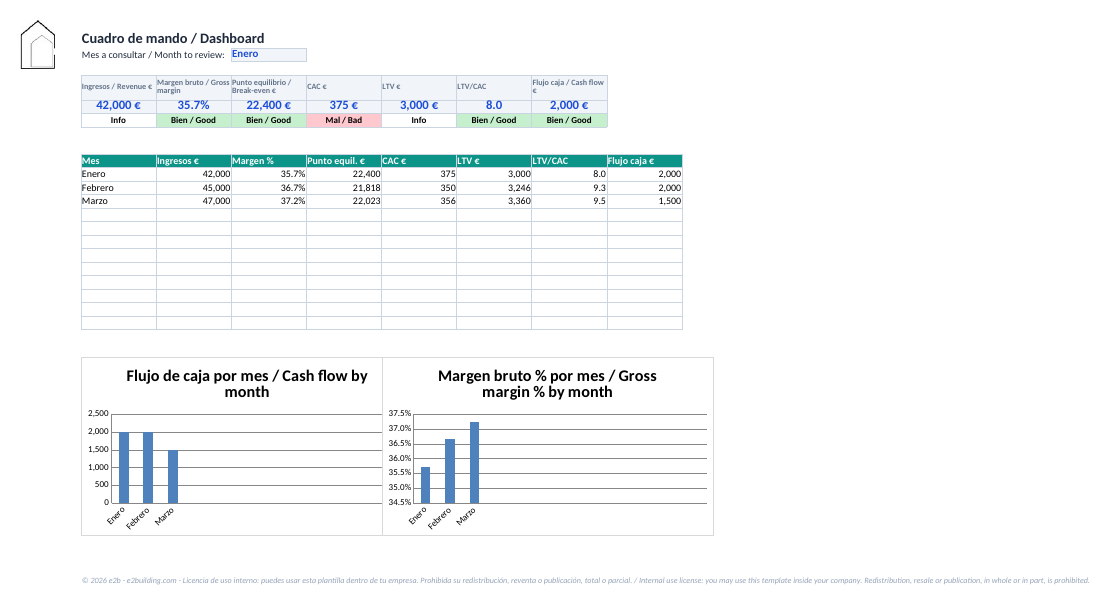
Pick the month and see the 5 KPIs in green, amber or red against YOUR red lines, not a generic standard.
→ The 5 KPIs that matter
Gross margin, break-even, CAC, LTV (and LTV/CAC) and operating cash flow. Calculated automatically from your data.
→ Targets sheet
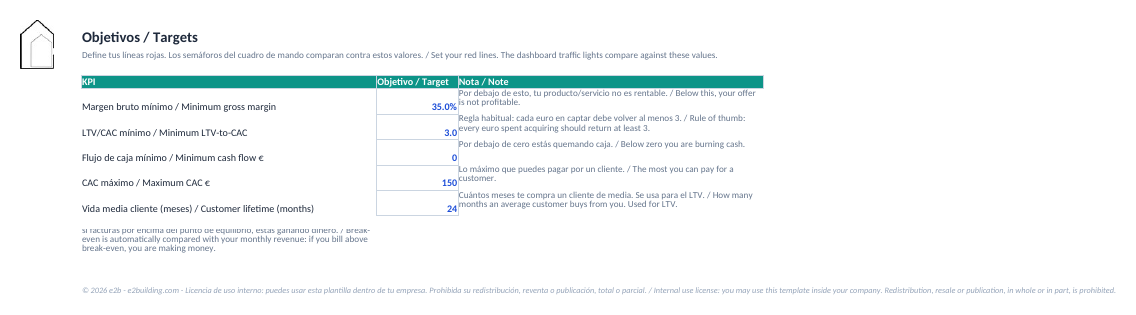
Set your minimum margin, minimum LTV/CAC and minimum cash once; the dashboard compares against them forever.
→ Monthly data in one row
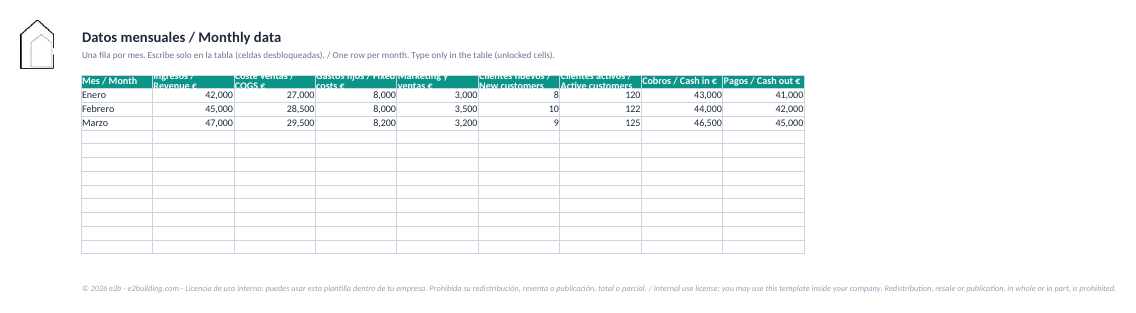
One row per month: revenue, costs, marketing, customers and cash. You only type in the white cells.
→ Automatic charts
Monthly margin and cash-flow trends draw themselves as soon as you enter the data.
→ PDF guide (4 pages)
What each KPI means, what to do when a light goes red and the classic measurement mistakes. In English and Spanish.
Single bilingual file: headers and instructions in Spanish and English. Calculation cells are locked so nobody breaks the formulas; you only type in the input cells.
What it looks like inside
How it works
- Set your red lines on the Targets sheet (minimum margin, minimum LTV/CAC, minimum cash).
- Once a month, fill one row in Data: 15 minutes with your invoices and expenses in front of you.
- Open the Dashboard, pick the month and read the lights: green = fine, amber = watch, red = act now.
- If a light stays red two months in a row, open a corrective action (pairs with the 90-Day Plan template).
A dashboard isn't for looking at: it's for deciding. This one is built so that in 15 minutes a month you know whether the business is going where it should.
Who it's for
For the owner or manager of an SME (industrial or services) running the business by gut feel or with an accounting spreadsheet that doesn't answer the only question that matters: am I doing well or badly?